The Impacts of Using a GeoSpatial Tool: Results from evaluations of SeaSketch’s predecessor published
/Why should we invest in geospatial tools? What makes them so valuable in science-based participatory process? In light of exciting progress toward the U.S. National Ocean Policy and marine spatial planning goals globally, and the proliferation of mapping portals and tools to support this work, we share this critical examination of MarineMap, the award-winning mapping platform that supported California's Marine Life Protection Act Initiative. From 2012 to 2014, the McClintock lab collaborated with Amanda Cravens, to investigate MarineMap, the predecessor to SeaSketch. A paper describing part of the results of that research was recently published, and we have boiled down the key lessons learned in this post.
From 2012 to 2014, the McClintock lab collaborated with Amanda Cravens, to investigate MarineMap, the predecessor to SeaSketch. A paper describing part of the results of that research can be found here:
Cravens, A.E. Negotiation and decision making with collaborative software: How the geospatial decision support tool MarineMap ‘changed the game’ in California’s Marine Life Protection Act Initiative. Environmental Management. 57(2), 474-497. doi: 10.1007/s00267-015-0615-9 (or read this 2-page summary brief)
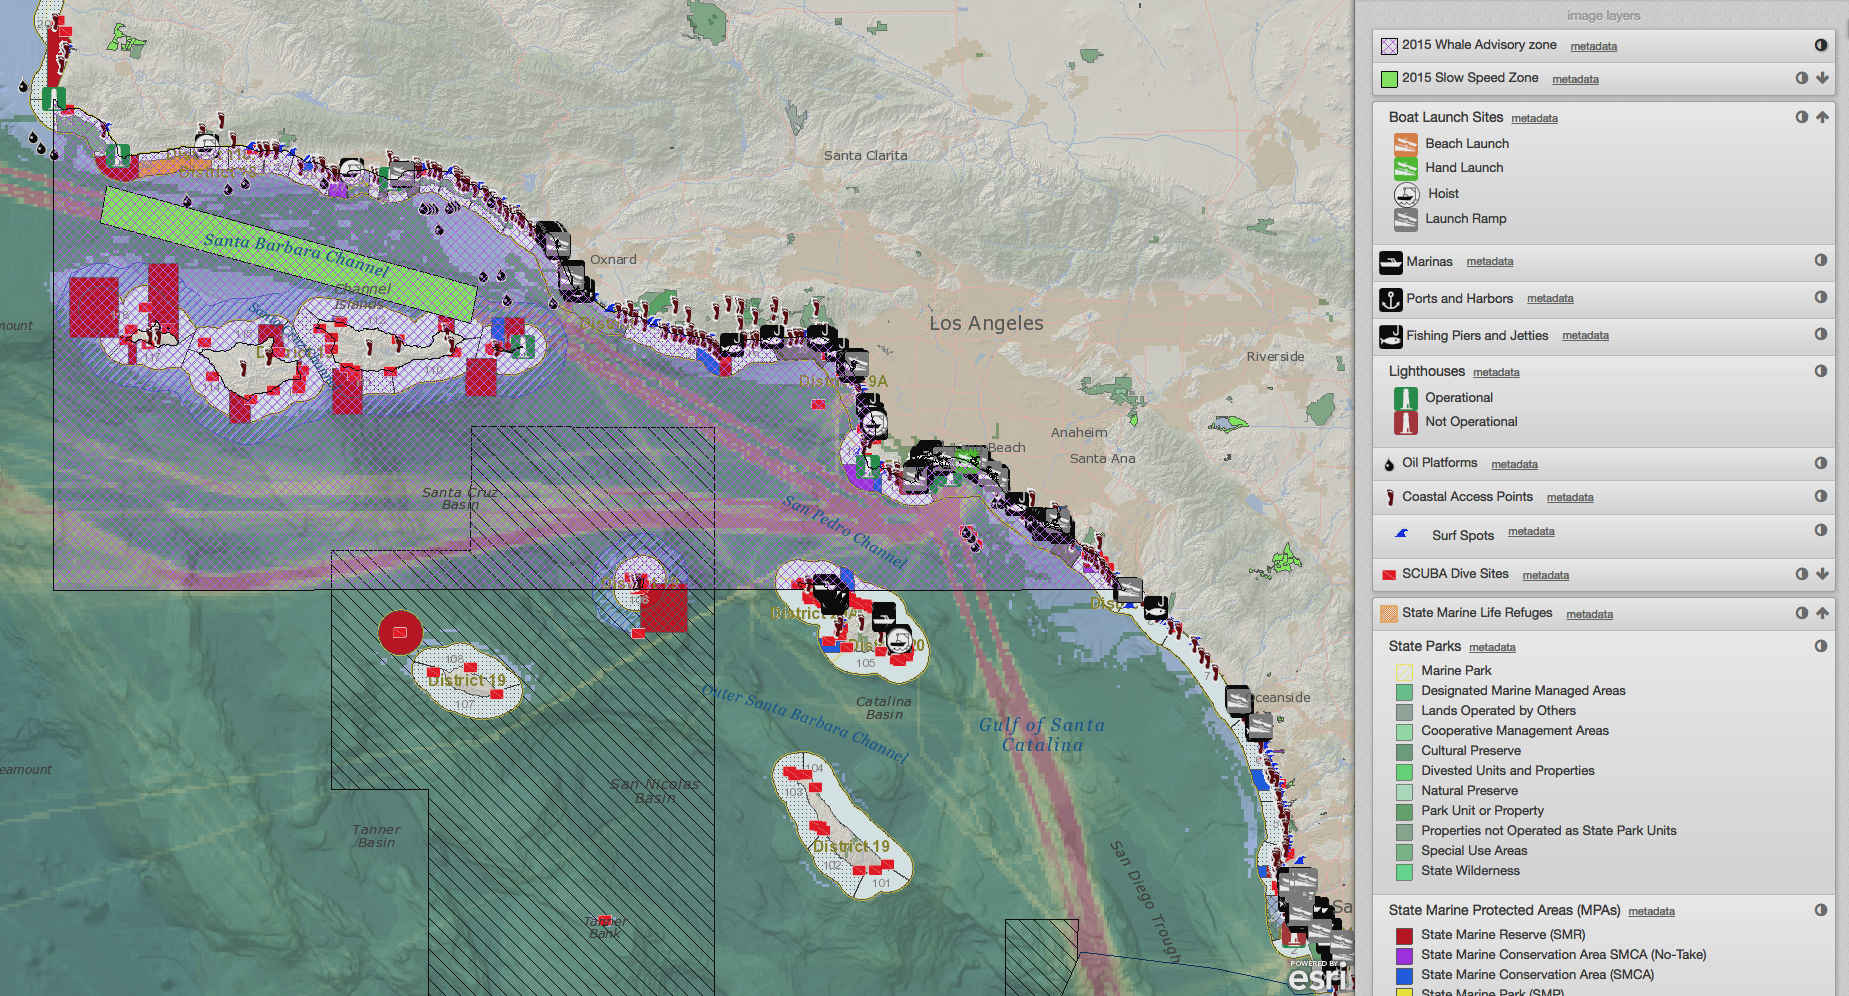
MarineMap (a joint project of the McClintock lab, Ecotrust, and The Nature Conservancy) was developed to help participants in California’s multi-year Marine Life Protection Act (MLPA) Initiative decide where to cite marine protected areas (MPAs) along the state’s 840-mile coastline.
Amanda’s study made use of interviews with users, a participant survey, analysis of video captured at meetings where MarineMap was used, and analysis of the application’s log files.
The five key ways MarineMap added value
- Helped users understand science criteria by which their proposals would be evaluated. MarineMap gave users the capacity to see how the science guidelines evaluated areas they knew intimately in the physical world.
- Facilitated communication between various participants by creating a common language. The way that participants used MarineMap as a shorthand vocabulary suggests that many users’ understanding of the information was closely tied to the depiction of it presented in MarineMap. Thus it wasn’t just a medium for communication, but a medium for shaping common understanding.
- Helped users understand geography holistically with combinations of data and at scales greater than most people’s personal experience. Notably, as a marine planning exercise, it allowed users to visualize relationships between habitat and substrate under the ocean in a way that few except divers or spear fisherman had done before.
- Helped users identify shared or diverging interests and thus gave them a better understanding of what was causing conflict in a given area. One interviewee described the tool as a way to “not concede ground, but look at it.”
- Facilitated joint problem solving by aiding users in identifying mutually acceptable options amongst a plethora of choices and making the implications of tradeoffs clear.
The research also emphasized, however, that the same tool features that led to these benefits could also cause challenges for certain users in certain circumstances. Take the example of the spatial user interface. While there were many reports about how that feature added value (e.g. by providing a visual aid and thus aiding communication), in other cases the spatial interface design meant data that did not appear within the tool essentially did not exist within the process. For one city employee concerned that MPAs line up with city jurisdiction lines to make enforcement easier, the fact that MarineMap (at that time) did not contain city boundaries meant she was unable to convey this concern to others. She described drawing the boundaries on scraps of paper, getting nowhere, and as a result years later still trying get a boundary moved 100 feet south.
Amanda’s research described how different user groups made use of the software, identified specific ways that MarineMap added value to the marine planning process, and linked each mechanism to particular tool features.
The study also highlights how important the social context in which software is implemented is to shaping how DSTs add value. For instance, the “service orientation” of the development team seems to have contributed to users’ positive experience.
This empirical study of a decision support tool suggests we need to adopt a more nuanced view of “pro” and “con” when thinking about how tools work in decision-making processes. The same features that add value in one circumstance may create challenges in others. Calls to remove “bias” are misguided as any DST will have some bias built in; these applications work by simplifying the world into a useful representation. What managers and facilitators can do is pay attention to the specifics of how a tool is influencing problem solving, negotiation, and decision making for individuals in particular processes. Besides tool features, the social context in which tools are designed, implemented, and later maintained or retired matters to participants’ experience. These results also point to the importance of incorporating the impact of a DST into evaluations of policy processes that use such software.
Amanda Cravens is currently a Research Social Scientist with the U.S. Geological Survey. The research described in this blog post was completed while she was at Stanford University.

